For medium-sized service providers, marketing ROI tracking is crucial to measure campaign effectiveness and optimize spending. Excel + AI automation can:
✅ Track campaign performance in real-time
✅ Automate cost & conversion analysis
✅ Provide AI-driven insights for smarter decisions
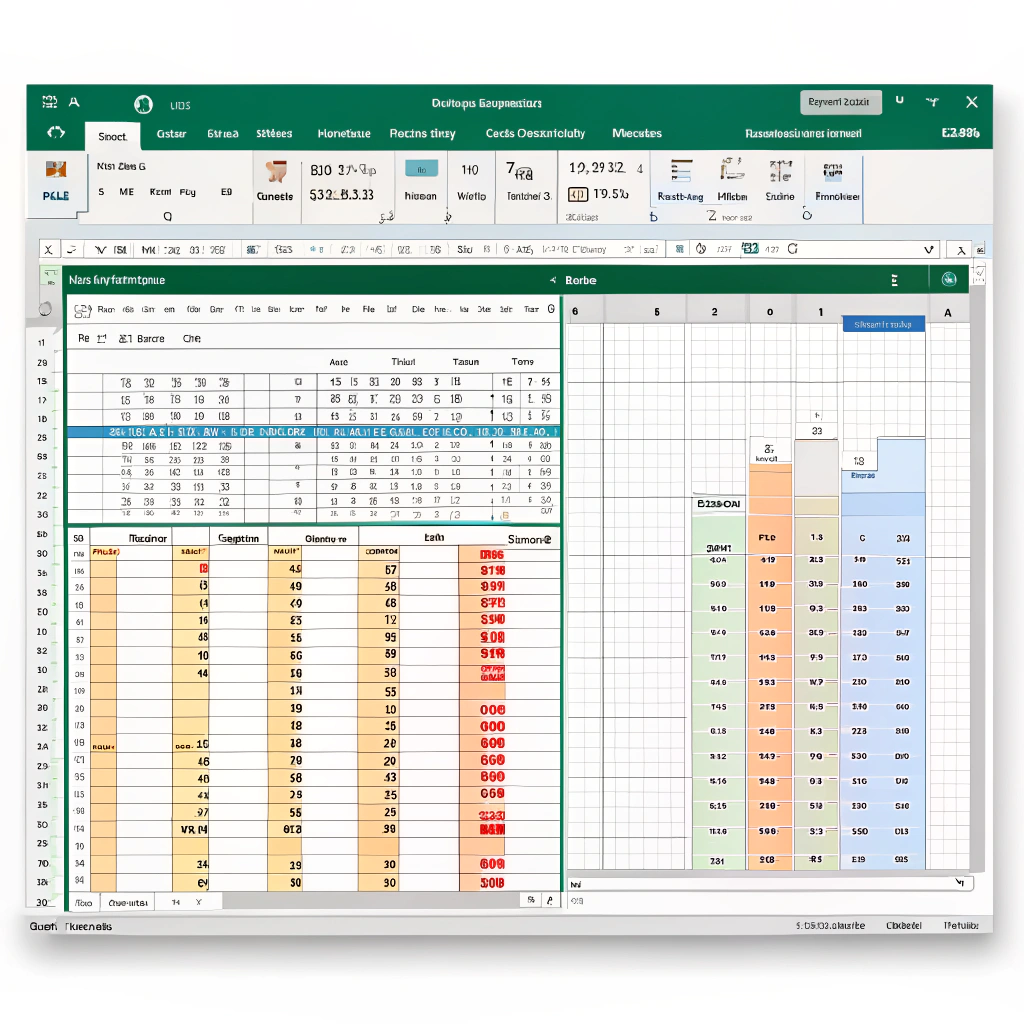
Step 1: Setting Up a Marketing ROI Dashboard in Excel
Create an Excel table with key marketing data:
Campaign Name
Channel
Budget ($)
Clicks
Leads
Conversions
Revenue ($)
ROI (%)
Facebook Ads
Paid Ads
Step 2: Automating ROI Calculation in Excel
To calculate Return on Investment (ROI):
= ((G2 - C2) / C2) * 100✔ Compares marketing spend vs. revenue
✔ Shows profitability of each campaign
Step 3: Automating Conversion Rate Tracking
To calculate Conversion Rate (CR):
= (F2 / D2) * 100✔ Helps identify high-performing campaigns
✔ Focuses budget on high-converting channels
For automated tracking using Python & Pandas:
import pandas as pd

# Load marketing data
df = pd.read_excel("marketing_data.xlsx")

# Calculate ROI and Conversion Rate
df["ROI (%)"] = ((df["Revenue ($)"] - df["Budget ($)"]) / df["Budget ($)"]) * 100
df["Conversion Rate (%)"] = (df["Conversions"] / df["Clicks"]) * 100

# Save results
df.to_excel("updated_marketing_data.xlsx", index=False)
✔ Updates Excel automatically
✔ Saves time on manual calculations
Step 4: AI-Powered Campaign Performance Prediction
To predict future ROI, use Linear Regression in Python:
from sklearn.linear_model import LinearRegression
import numpy as np

# Prepare data
X = df[["Budget ($)", "Clicks", "Leads"]].values
y = df["Revenue ($)"].values

# Train AI model
model = LinearRegression()
model.fit(X, y)

# Predict revenue for a new campaign
new_campaign = np.array([[3000, 18000, 1500]])  # New budget, clicks, leads
predicted_revenue = model.predict(new_campaign)
print(f"Predicted Revenue: ${predicted_revenue[0]:,.2f}")
✔ Forecasts future revenue based on past performance
✔ Helps optimize ad spend for maximum ROI
Step 5: Visualizing Insights in Excel
To spot trends, create:
📊 Pivot Tables → Show ROI per channel
📈 Line Charts → Display revenue growth over time
🟢 Conditional Formatting → Highlight high-performing campaigns
Example Conditional Formatting Rule (for ROI > 100%):
=IF(H2>100, TRUE, FALSE)✔ Green highlight for successful campaigns
Step 6: Automating Weekly ROI Reports
To send automated email reports, use this VBA script:
Sub SendMarketingReport()
    Dim OutlookApp As Object
    Dim OutlookMail As Object
    Dim ws As Worksheet
    Dim lastRow As Integer
    Dim i As Integer
    Dim emailBody As String

    Set ws = ThisWorkbook.Sheets("Marketing ROI")
    lastRow = ws.Cells(Rows.Count, 1).End(xlUp).Row
    Set OutlookApp = CreateObject("Outlook.Application")

    For i = 2 To lastRow
        emailBody = "Campaign: " & ws.Cells(i, 1).Value & vbCrLf & _
                    "ROI: " & ws.Cells(i, 8).Value & "%" & vbCrLf & _
                    "Conversion Rate: " & ws.Cells(i, 9).Value & "%" & vbCrLf

        Set OutlookMail = OutlookApp.CreateItem(0)
        With OutlookMail
            .To = "marketing@company.com"
            .Subject = "Weekly Marketing ROI Report"
            .Body = emailBody
            .Send
        End With
    Next i
End Sub
✔ Sends automated weekly marketing reports
✔ Keeps the team updated without manual work
Key Benefits of AI-Powered Marketing ROI Tracking in Excel
✅ Tracks campaign performance in real-time
✅ Automates ROI & conversion calculations
✅ Uses AI to predict future marketing success
✅ Sends automated reports to stakeholders
With Excel, AI, and automation, service providers can maximize their marketing impact while reducing wasted ad spend!

Lillqvist Strat consults on business developement, software projects, automation, SOPs, analytical tools and more.
Contact me today to get started on our journey to higher profits, more revenue and happier employees!
Go to Contact now